
Photograph: Brian Sumner, Unsplash
Prevention economics · for institutions
There is no photograph of the flood that didn’t happen.
Prevention economics for institutions that would rather pay for the flood that doesn’t happen than the one that does.
- Developed by Laurie Lane-Zucker; introduced in The Impact Entrepreneur Breakthrough (Berrett-Koehler, 2026), a #1 Amazon Best Seller in Green Business
- In partnership with Impact Entrepreneur, PBC
The security paradox
You are already funding your problems.
Institutions keep detailed books on the cost of harm and almost none on the cost of preventing it. Follow one security dollar.
We are spending more and more to feel less and less secure.
$2.9 trillion
Global military expenditure in 2025, the highest share of world GDP since 2009.
SIPRI, April 2026
10–20¢
Of each security dollar spent upstream, on prevention.
Prevention Ratio™ context band
$4–$7
Returned per $1 of natural-hazard mitigation.
Benefit–cost ratio NIBS, 2019
The standard
Read your own ledger.
Every institution already keeps these numbers. They sit in different departments, and nobody adds them up. An institution’s budget is the truest autobiography it will ever write.
| Reaction | Prevention |
|---|---|
| 1Emergency response & recovery operations | 1Infrastructure resilience & maintenance |
| 2Insurance premiums & risk transfer | 2Ecosystem stewardship & green infrastructure |
| 3Physical security, surveillance & enforcement | 3Community health & prevention programs |
| 4Incident remediation, litigation & liability | 4Workforce & local economic development |
| 5Crisis management & communications | 5Governance, trust & civic capacity |
| Of each dollar80–90¢ | Of each dollar10–20¢ |
1
The Ratio
Of every security dollar, how many cents go upstream? Upstream spending goes to preventing harm: maintenance, wetlands, clinics, job training. Downstream spending pays for harm once it has happened: emergency response, insurance, repairs, lawsuits. The upstream share is your Prevention Ratio™, and most institutions have never worked theirs out.
2
The Dividend
What prevention pays back, field by field. The evidence comes in different kinds of numbers: disaster mitigation is counted in dollars saved per dollar spent, early-childhood programs as a yearly rate of return. The Prevention Dividend™ reports each finding in its own terms, with its source. It doesn’t add them into one big number, because they measure different things.
3
The Reallocation
Moving money from response to prevention in steps a budget can absorb, with the evidence on the table when the council or board decides. Reactive spending purchases the same year over and over. Preventive spending can purchase different futures.
Real security
Five pillars, not one wall.
Security rests on five foundations at once, and trouble in any one of them puts the others at risk.
I
Ecological stability
How healthy are the natural systems we depend on?
II
Public health capacity
Can our health systems prevent crises rather than only treat them?
III
Economic equity
Is economic security broadly shared and shock-resistant?
IV
Democratic infrastructure
Do governance systems enable collective problem-solving?
V
Community cohesion
Are social bonds strong enough to enable collective action?
Swipe to see all five →
Most security spending goes to symptoms and leaves these foundations underfunded. The Five Pillars show where each dollar actually lands.
The instrument
The Prevention Ledger.
A free tool: work out your Prevention Ratio and explore the evidence behind the Prevention Dividend, drawn from the book.
Part One works out the share of your security spending that goes to prevention, from two totals or across ten categories, and sets it against the book’s 10–20% context band. Part Two shows what the published evidence says a dollar moved to prevention tends to return, with the kind of number marked on every card.
Nothing you enter leaves your browser.
The craft
What the Ledger cannot tell you, an engagement can.
The Ledger gives you a rough number and the published evidence. It can’t sort the budget lines that are part prevention and part response, decide which budgets belong in the count, or turn a range into a decision. An engagement does that work.
Eight weeks
Defense Audit
- A Prevention Ratio baseline for your institution
- A Five Pillars assessment
- What prevention could return, field by field, in ranges
- A plan for moving money to prevention
- An executive presentation to leadership or board
Twelve to sixteen weeks
Resilience Blueprint
- Prevention investments that strengthen several pillars at once
- Ways to pay for them, from shifting budgets to blended finance
- A plan for carrying it out
- A plan for keeping decision-makers on board
Continuing
Advisory
- Ongoing advice for institutions that have decided to act
- Offered after an audit or a blueprint
- A quarterly review of how your spending is shifting
Built for
The question that opens the conversation.
Cities & regions
What would your next mitigation dollar return? U.S. federal mitigation grants have averaged about $6 for every $1.
Foundations
What share of your grant portfolio goes upstream, to prevention?
Corporations & utilities
Your risk register treats symptoms. What are the systems underneath?
Swipe to see all four →
On the record
In print and on the record.
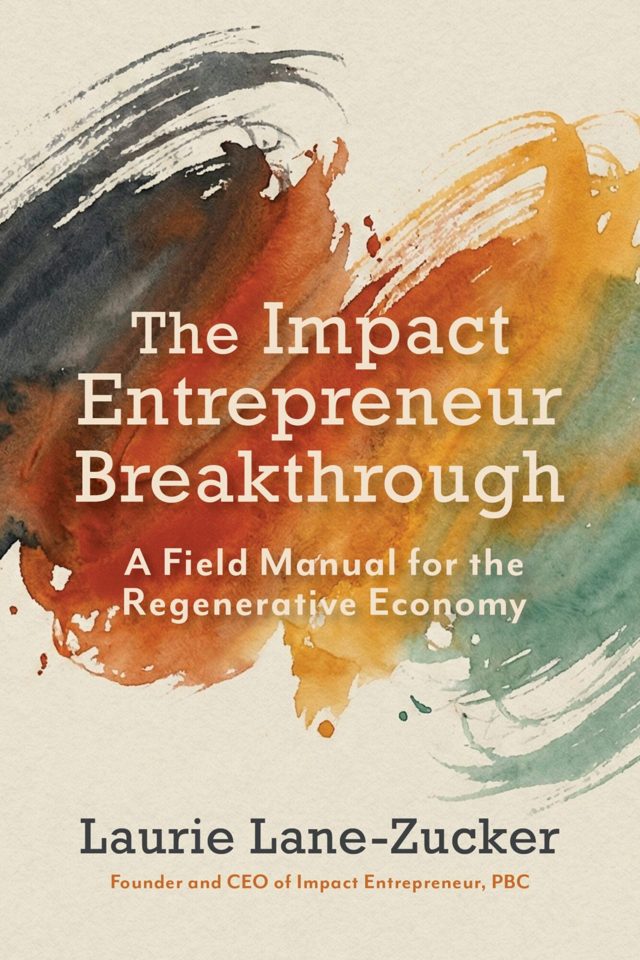
#1 Amazon Best Seller · Green Business
The Impact Entrepreneur Breakthrough
Part III, Protection, introduced the Five Pillars of Real Security, the Prevention Ratio and the Prevention Dividend, and the case for Defense as a Service™. Berrett-Koehler, 2026.
Field notes
- Oct 11, 2026 · EssayWhat a Minute Costs (opens in a new tab)Counting what we fail to prevent, sixty seconds at a time.
- Sept 2, 2026 · ImpactAlphaThe Prevention Dividend: Investing Before the Damage Is Done (opens in a new tab)Impact investors may be overlooking one of the largest markets hiding in plain sight.
- Sept 1, 2026 · EssayPrevention Economics (opens in a new tab)Two measures, seven principles, three kinds of practitioner, four open problems.
- SuperCrowd26 · TalkThe Prevention Dividend: Impact Investing’s Best-Kept SecretA twenty-five-minute talk on the argument, recorded at SuperCrowd26.
Institutions that move early stand to capture the Prevention Dividend while others continue paying the escalating costs of reaction.
A first conversation is a diagnostic, and it costs nothing.